Behavioral Finance Game Biometric Research
Exploring iMotions’ emotion recognition technology through two studies employing an online behavioral finance game to measure engagement of college students in decision-making scenarios

Overview
Project:
The College Behavioral Finance project began as an exploratory research study to test the capabilities of emotion recognition software used in the context of UX research – an uncharted territory for the technology – with specific goals for testing gaming as a tool for learning and shaping financial behavior in first-year college students. Through two iterations over nearly a year, the study yielded little in definitive answers about the tool’s proven efficacy in this narrowly-defined sector, but much about best practices for the use of biometric technologies in UX.
Goals:
Create study related to behavioral finance and gaming to relay findings at upcoming Face of Finance conference
Explore biometric technology as a means to measure the efficacy of gaming as an educational tool
Explore research question: Will a game teach students to make good choices with their money?
Company: In-house project for the User Experience Center consulting firm
Team: Senior Consultant and 3 Design Researchers
Role: Design Researcher
Research + Study Design
Study Moderation
Data Synthesis
Presentation
Tools: Facial Recognition Software, Galvanic Skin Response, Eye-tracking
Date: 2019-2020
Tools

Study Background
The College Behavioral Finance project began as an exploratory research study to test the capabilities of new iMotions emotion recognition software gifted to the User Experience Center. We wanted to engage in a study around gaming and behavioral finance to present findings at the UXC’s upcoming Face of Finance conference for user-centered design in financial services.
While emotion recognition technology is commonly used in the entertainment and marketing sectors, its use is uncharted in UX research, where stringent requirements for employing biometric recordings with technologies such as GSR and eye tracking already exist. This was an appealing challenge for us to explore.
This is a two-part project, with a second study emerging after the first revealed challenges to using emotion tracking in the way the experiment was conducted. I started with the User Experience Center after first study data collection, so my focus was in assessing the first study and implementing changes to the second to strengthen findings. This case study will focus on that process.
Payback Game (Studies 1 + 2)
To incorporate behavioral finance with gaming, we engaged study participants with an online financial decision-making game, Payback at TimeforPayback.com, and measured emotional reactions during game play.
Payback follows the path of a typical college student as choices are made about school selection and daily or special activities that could affect financial well-being. Participants play short games while shopping for dorm supplies, registering for classes, or making decisions about choosing a major or dressing for job interviews.

The game tracks changes in Focus, Connection, Happiness, and Debt with each activity or decision...
…and the student succeeds as a graduate or fails if these metrics are depleted.
Process

First Study Assessment
First Study Testing
Participant Profile: mix of 8 pre-college or first-year college students from various universities
Tools: Emotion recognition software, GSR, and eye tracking device recorded reactions to game
Process: Participants used think aloud technique and self-reported emotions using Plutchik’s Wheel
First Study Limitations
Think aloud interrupted emotion data recordings
Game play too variable to provide accurate eye tracking heatmaps
Plutchik’s Wheel of Emotions did not map to iMotions’ six emotion categories: Joy, Anger, Surprise, Fear, Contempt, and Sadness
Unclear how to connect all of the data collected to tell study story
Overall finding: More control over all game variables necessary

Plutchik’s Wheel of Emotions
Second Study
Research + Reset
The Study 2 team included researchers like myself approaching the study with fresh eyes and ears, as well as those involved with the original study design. This provided an opportunity to reset some of our expectations about the work while relying on historical knowledge to help us make well-informed changes.
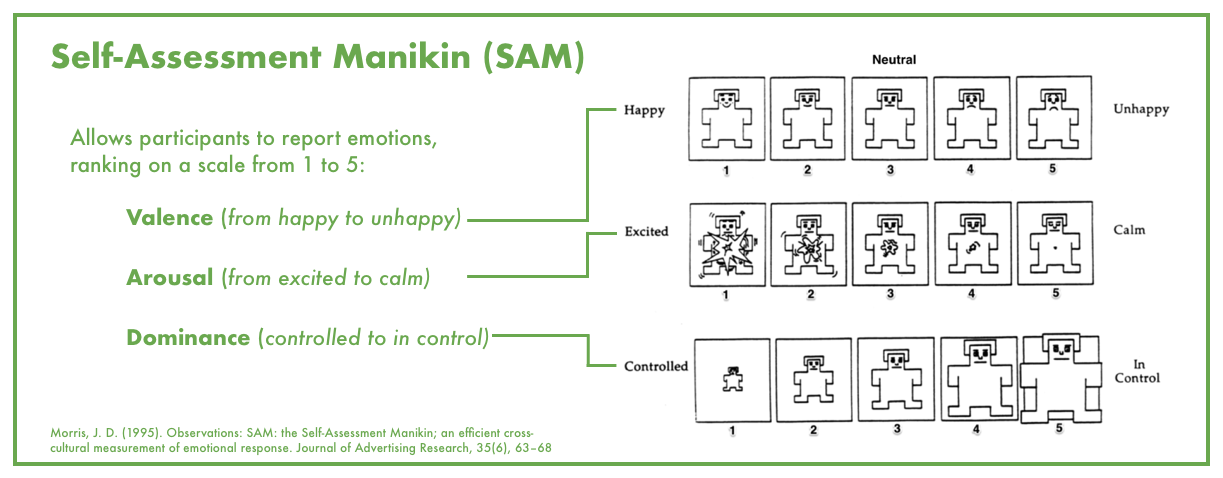
I began by reading Emotional Expressions Reconsidered: Challenges to Inferring Emotion From Human Facial Movements (Barrett et al., 2019) to understand the inherent challenges in deciphering emotional expressions across social, cultural, and other boundaries. We also researched and consulted experts to explore options beyond Plutchik’s Wheel for self-reporting emotions, eventually landing on the Self-Assessment Manikin (SAM).
Adjustments
Reviewing the limitations of the first study, we re-wrote the moderator’s guide to create a more restrictive study design with the following changes:
Tighten participant sample: selection of 10 first-year Bentley College students simplified recruit and provided control with shared experience
Add 2nd play-through of game to mitigate learning effect in gameplay
Remove eye tracking - ineffective for this study due to game variability
Use retrospective think aloud and pause data recording during reflection to reduce interruption to emotion recordings
Participants report emotions using visuals and scale on the Self-Assessment Manikin (SAM) rather than Plutchik’s Wheel
Testing
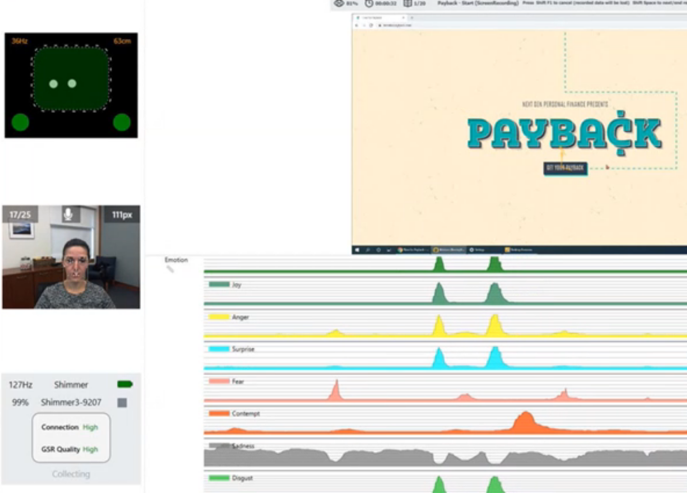
We completed 10 rounds of 60-minute long sessions over 3 days. The Payback game was played online while a moderator observed the participant in the lab space. Using iMotions’ emotion recognition software, the moderator noted emotion reading spikes in real time to inform questions asked post-test section.
Diverging from the first study, Study 2 took on a pattern of 1) gameplay, followed by 2) self-reporting emotions using a SAM online survey, and then 3) retrospective think aloud for each college year represented by the game.

Synthesize Data
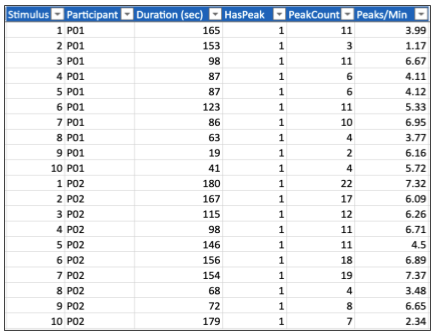
Understanding how to compare three very different types of information from emotion recognition software, galvanic skin response, and the Self-Assessment Manikin survey was a significant challenge to our data analysis.


iMotions data
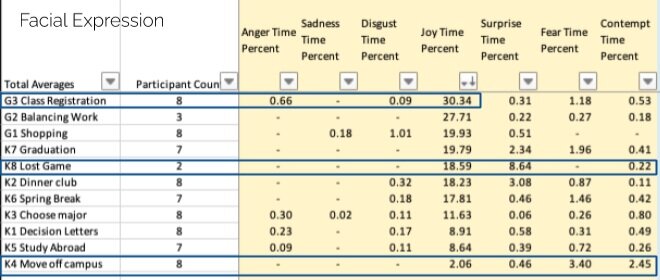
includes percentage of time that an emotion is present during the study, as well as more granular data about the time that facial attributes indicating this emotion (e.g., brow furrow) were present
GSR data
shows bursts of emotion activity (positive or negative) including duration, peak count, + peaks/minute
SAM data
involves three affective emotional responses, rated on a scale from 1-5, completed up to 10 times in a study
Triangulating Data
Again, we called on experts in the field to assist our team with data analysis, particularly when it came to analyzing statistical comparisons of iMotions data versus GSR recordings compared with SAM surveys. We noted overall trends in the data, then ran t-tests to correlate individual emotions recorded for each college year in Game 1 and 2 with SAM survey averages for Valance, Arousal, and Dominance in the same time frame.
Collected GSR data loosely correlated with the SAM data across these subsets, however, we found inconsistencies with our qualitative findings. Though participants self-reported they were happier, less excited, and more in control in Game 2, this feedback did not always align with SAM or iMotions data.

Correlation Table
Significant Findings
Wide disparity in emotion recordings among participants
Joy was the most dominant emotion recorded by iMotions software
Statistically significant difference between Game 1 and Game 2 in GSR data - participants showed more arousal (in higher peaks/min)
Inconsistency between self-reported emotions and data collected using biometric technology
Outside of GSR, there is no statistically significant difference in recorded emotions between Game 1 and Game 2

Challenges
Using new tools in uncharted territory - employing emotion recognition software and the Self-Assessment Manikin in UX research provided excitement, as well as challenges, as we learned to use the tools most effectively
Managing new and different data from these new tools
Participant numbers - without financial limitations, we would like to have increased participant numbers to 25+ for statistically significant results
Shifting teams - picking up and losing researchers on our team could be frustrating, but also lent fresh eyes to study design challenges
Variable game experience - not only did multiple-choice responses shift locations during every game play, but the online game was actively changing, with new mini-games added during the course of our study. With this variability, this game was ultimately not the perfect choice for the study.
Results + Reflection
This was a highly engaging study that provided our team with exciting challenges as we explored the capabilities of a tool new to both our firm and the broad field of UX research. Ultimately, we found little correlation between what participants said, their physiological responses to the gaming stimuli, and the recordings captured by the emotion recognition software under review.
This is not unexpected, however, and not just because of the novelty of this technology, but - as understood through our research and many ethnology/psychology studies that have come before us - human emotions are fickle! To definitely prove anything about the validity of emotion recognition technology in this function, not only would we need to provide a perfectly controlled study environment, but we would have to find test subjects fully in-tune with their felt emotions (perhaps not hormonal 18 year olds away from home for the first time during midterm exams, for instance) who displayed no conscious or subconscious efforts to mask facial gestures necessary for emotion readings through technology.
While the study did not provide us with conclusive insights about the use of emotion recognition software in UX research, it did open up an important conversation with our peers as we presented this work for the Boston UX Professionals Association (UXPA) and published our findings as a white paper and case study. What we can recommend from this study is to pull in as much biometric data as possible - from these new emotion recognition trackers and tried-and-true methods like eye tracking and GSR sensors - and triangulate this information for the most vivid picture of a user’s emotions. We also recommend consulting this list of best practices for future work in the field of emotion and biometrics in UX.
Best Practices for Using Biometrics in UX Research
Keep it consistent - limit variability in participants’ tasks and workflow by controlling study variables
Limit participant-moderator interaction during recordings to avoid biometric measurement interference
Triangulate data using multiple technologies - use diverse metrics to support your findings and tell your research “study story”
Consider the best environment and type of study for biometrics - tightly constrained studies & linear development environments (e.g., movie trailers, A/B testing, and validation/summative studies involving still images or still screens)


